Reading
As the impacts of the climate crisis continue to evolve, how are Melbourne’s neighbourhoods addressing sustainability, vulnerability and resilience?
Climate resilient neighbourhoods include qualities such as compactness with proximate access to services and infrastructure, low vulnerability to climate change impacts, and active support of biodiversity. The Index evaluates these characteristics via an online interactive map at various geographic scales.
Current urban challenges facing our cities
It is common knowledge that our cities are faced with various complex urban challenges, that raise questions about the type of city we want to create, as well as the equity of our urban spaces. These challenges range from increased urban heat resulting from intensified heatwaves (and the consequential health impacts), as well as the significant impacts on habitat and biodiversity due to land clearing resulting from rapid urban expansion.
As practitioners, we believe it is our responsibility to make use of our collective knowledge to support the creation of climate and biodiversity positive neighbourhoods. The Index facilitates this by providing a baseline of existing levels of climate resilience, that enables progress against key indicators to be measured.
Key indicators
The Climate Resilience Index evaluates the determinants of Melbourne’s urban environments that impact sustainable living, including built and natural features. The four key indicators framing the analysis, and what is measured within each, are as follows:
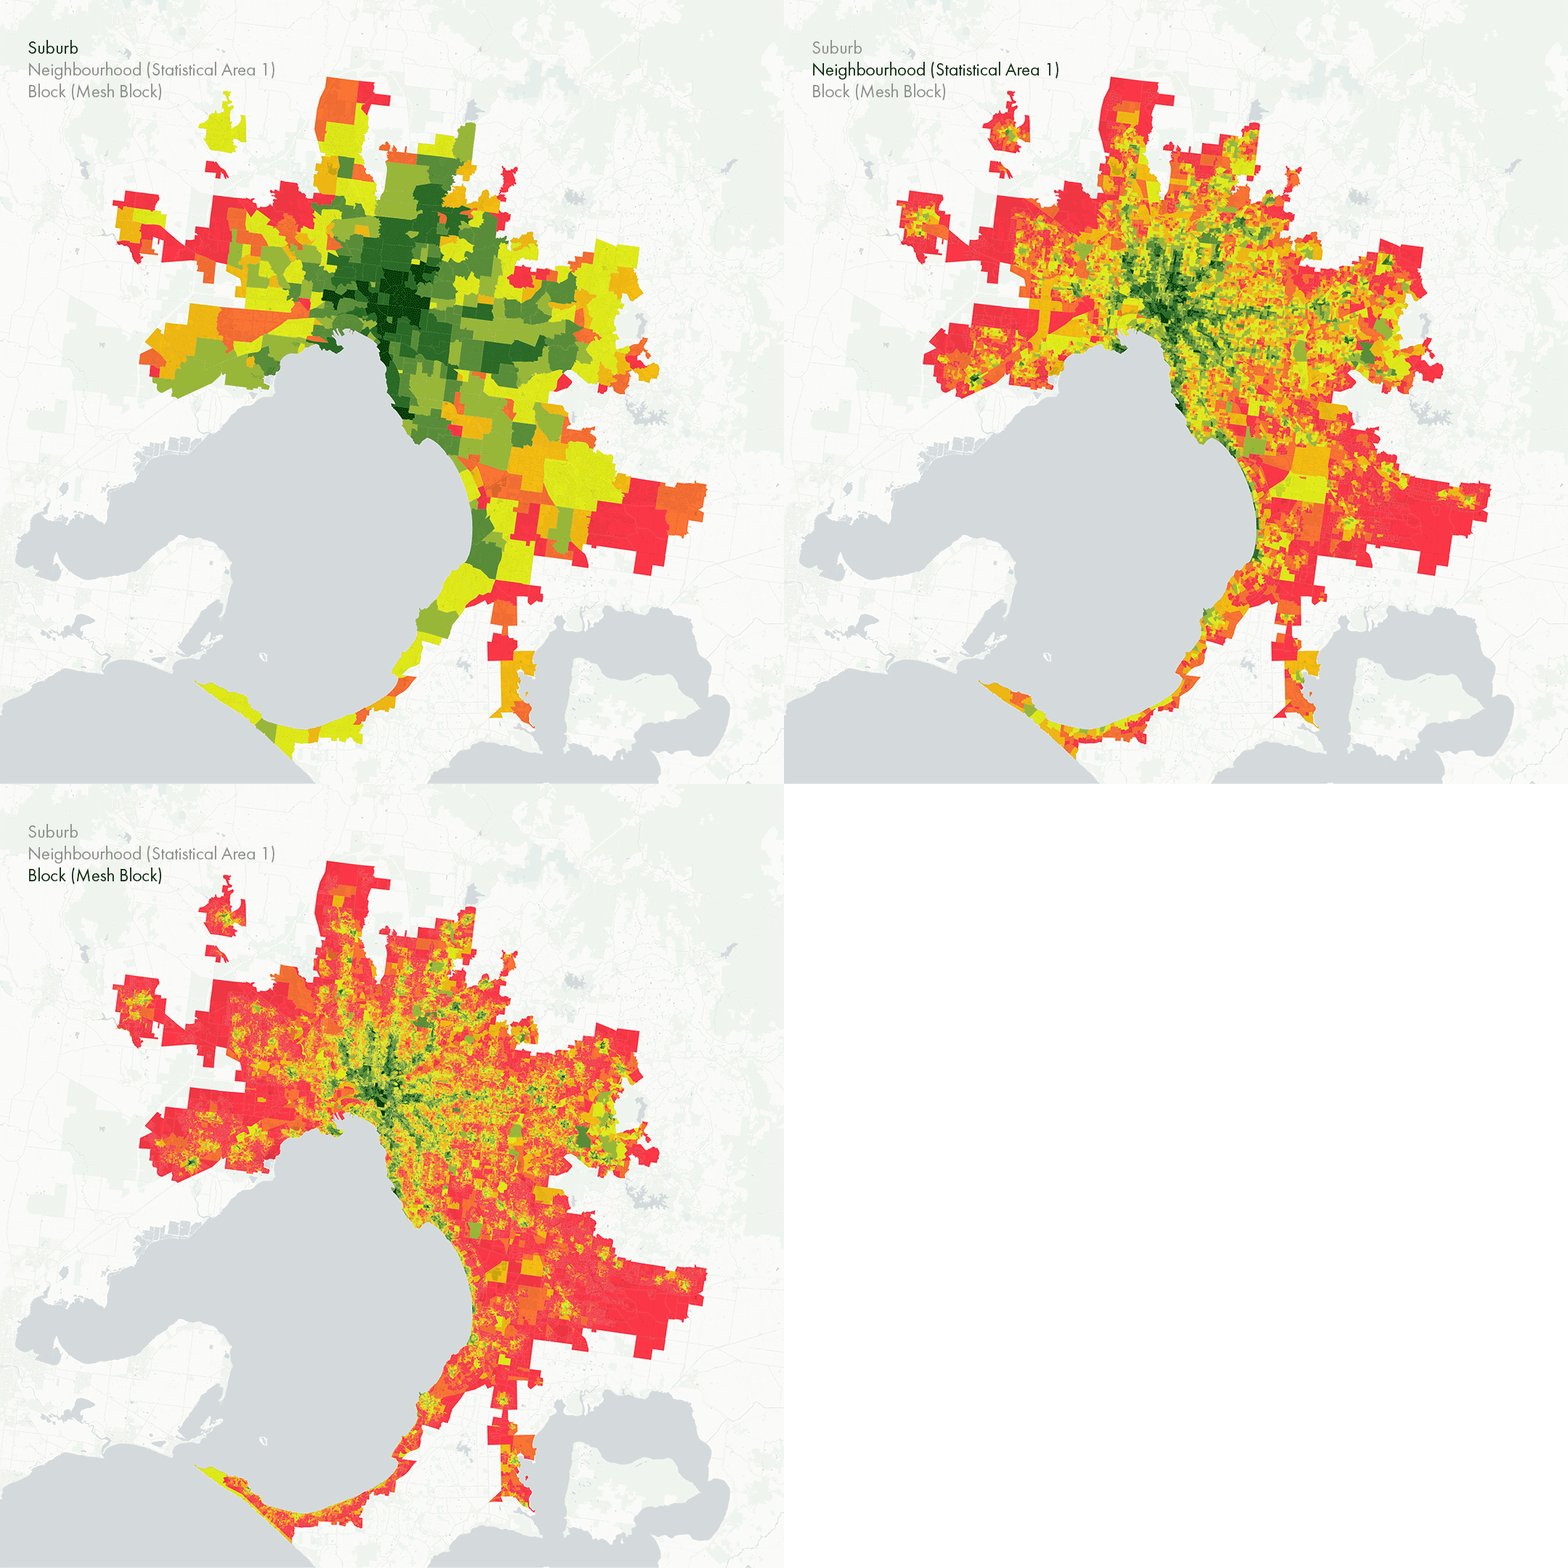
The Index aggregates and disseminates data so that users can look at varying scales, ranging from street blocks, through to the broader suburb. Each indicator comprises of a network of sub-indicators, to ensure that the study includes a wide range of relevant considerations and best reflects how we experience our neighbourhoods.

Amenities
Evaluates the efficiency of land use including access to core services, amenities, recreation space, education and employment opportunities.

Transport & Movement
Considers proximity to functional and frequent public transport, and a permeable pedestrian network.

Environment & Biodiversity
Analyses the proportion of canopy coverage, blue and green space, as well as ecological connectivity.

Hazard Resilience
Evaluates areas prone to flooding, coastal inundation, bushfire risk and urban heat effects.
Navigating the index
The Index is a user-friendly interactive map that allows users to navigate the study area at multiple scales, as well as across the four key indicators. A walk-through video that outlines the various features of the interactive map is embedded in the About tab of the website.
The following provides a guide for how to use the tool:
- Select an area. This enables a pop-up that outlines the Climate Resilience Index and indicator scores.
- It will then show details to investigate the input metrics (that comprise the Climate Resilience Index and indicator score for each area).
- Rankings for each suburb can be filtered through the search function on the left of the screen.
- The ranking and map can be styled by selecting the four indicators at the top right labelled; amenities, environment and biodiversity, transport and movement, and hazard resilience.
- Utilise the address search function to view results for a particular property (measured to mesh block scale).
- Select Suburb, Neighbourhood or Block to view the map at the various scales.
What are the capabilities of the index?
The Climate Resilience Index is a starting point for practitioners and community to recognise urban issues and seek out targeted solutions. It has capacity to inform strategic decision making at a metropolitan scale level as well as considering the cumulative impact of small-scale interventions. More specifically, the Index integrates biodiversity values into a land use planning framework at a metropolitan scale.
It also has the ability to zoom in to mesh block scale to provide a level of granularity often difficult to see. This is important because the level of data aggregation can dramatically change the story of climate resilience and biodiversity. This helps to make sure that decision making and interventions are being guided by more accurate data that reveals the complexities within an area.
The intention of the Index is not to specify an area as having the goal of climate resilience as there are improvements that can be made in all our neighbourhoods. We encourage you to explore the findings of the Index for yourself.
Interested in finding out more?
Tract invites all practitioners and communities to explore the Climate Resilience Index and investigate ways to support climate and biodiversity positive neighbourhoods.
If you have any questions relating to this project, please get in touch with Shruti Dalvi.


